Treasury Platforms, Business Intelligence Tools, or Excel: What Works Best for Forecasting and Reporting?

Treasury teams don’t lack data, but they often lack foresight. Being able to anticipate financial shifts is not just about having dashboards or models. It depends on whether systems and workflows create clarity, trust, and adaptability.
Many teams still rely on Excel. Others use Business Intelligence (BI) tools such as Power BI or Tableau. Some invest in a dedicated treasury solution. Each method offers value, but it’s important to evaluate which one truly helps your team become proactive.
To assess that, it helps to focus on four core capabilities: real-time cash data, driver-based forecasting, scenario planning, and reporting that improves with every cycle.
Real-Time or Near-Real-Time Cash Data
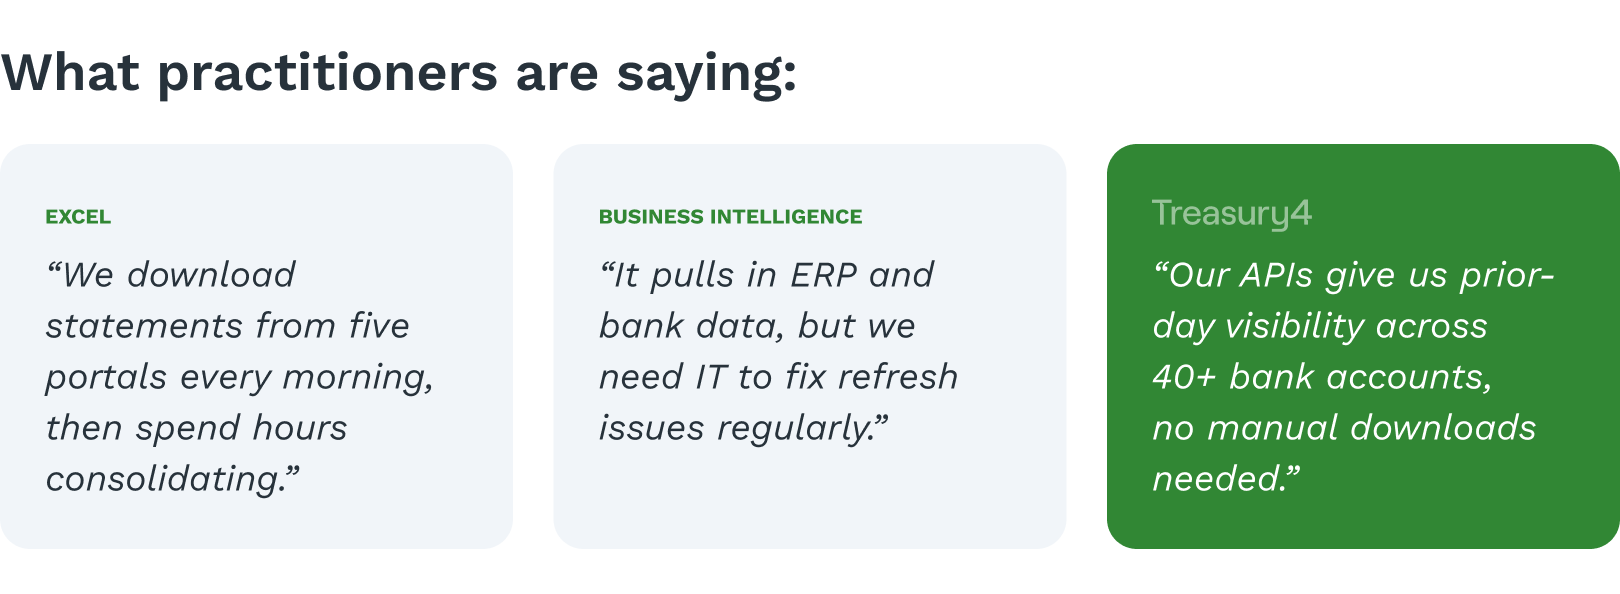
The first step to forward-looking treasury is having an accurate picture of your current position. Without timely and reliable cash data, even the best forecasting models will be off target. Cash and treasury platforms typically include direct bank connectivity through APIs that deliver up-to-date balances across all accounts and entities. BI tools can visualize this data well, but they require consistent, clean inputs. Excel usually relies on manual downloads, emailed statements, or reconciliations that are already out of date.
When finance leadership asks for a current global position, a modern treasury platform can provide that view immediately. Using Excel, it often takes hours of gathering, checking, and assembling data. When your data is both current and consolidated, your team is equipped to make timely decisions.

Driver-Based Forecasting
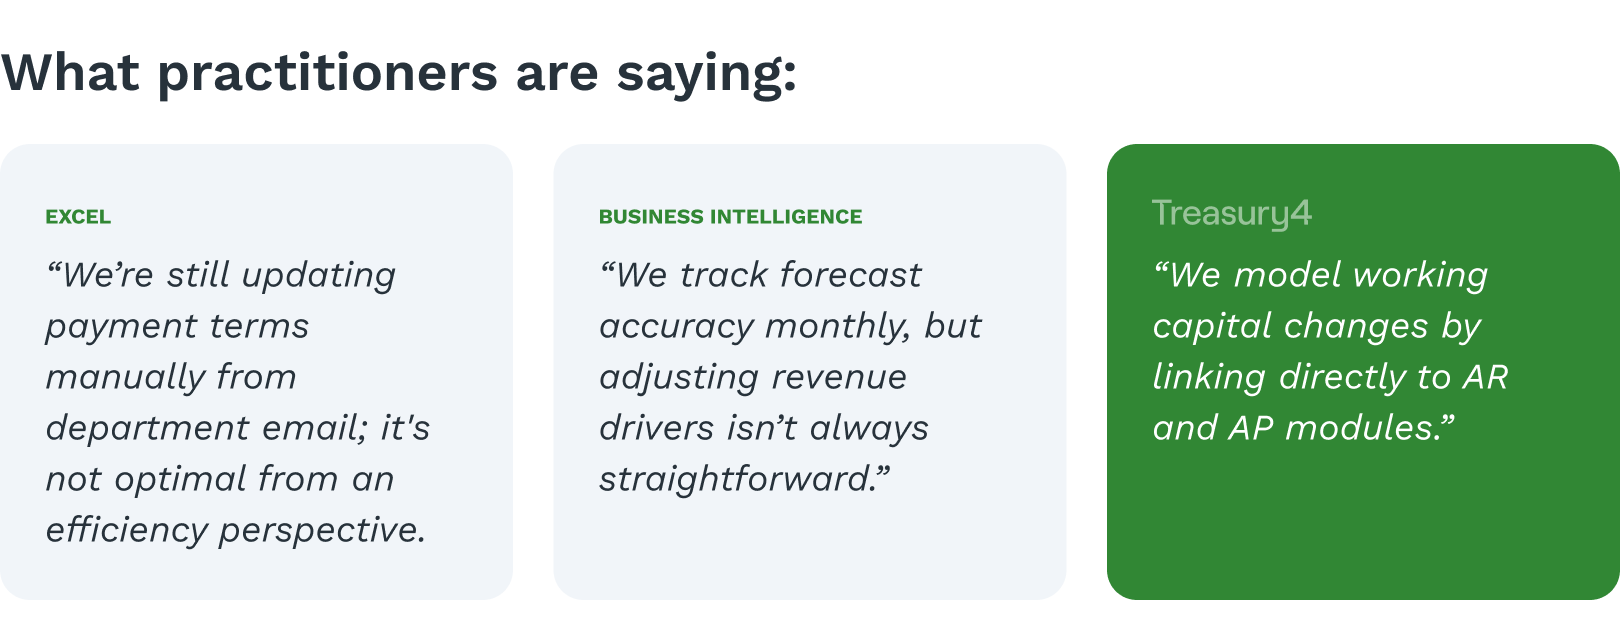
Forecasting is most effective when it mirrors the business conditions that drive cash flow. Excel-based models often use static inputs like historical averages or fixed growth rates. These don’t change when customer payments are delayed, payment terms are renegotiated, or operational expenses shift.
Modern treasury platforms allow forecasts to be tied to operational metrics such as days sales outstanding, vendor payment cycles, or payroll dates. BI tools can support this approach too, especially when integrated with ERP systems, though they typically require more configuration. While Excel offers flexibility, it rarely includes mechanisms to evaluate forecast accuracy or automatically update projections.
Using real-world drivers not only improves the accuracy of forecasts but also provides a clearer explanation of how projections are built. This transparency enhances credibility and helps treasury teams better align with leadership.
Scenario Planning
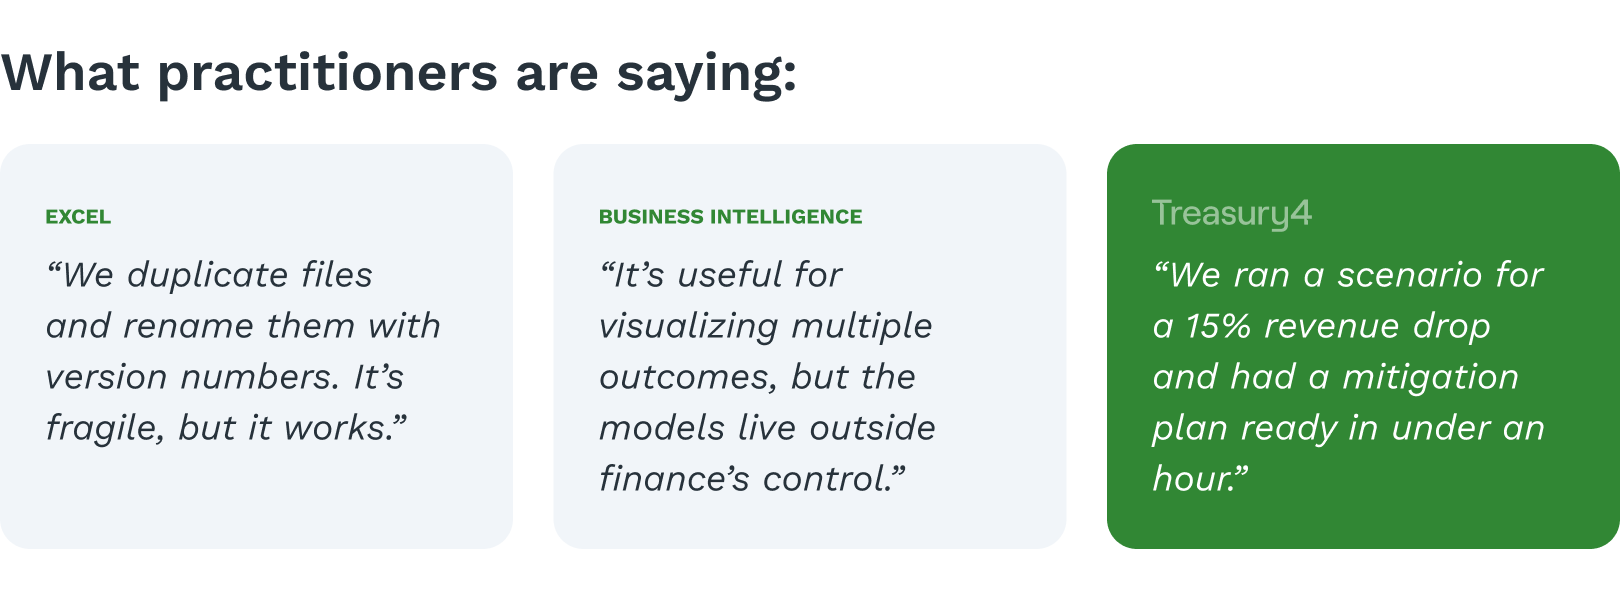
Finance teams are often asked to prepare contingency plans or assess the impact of sudden changes. When relying on Excel, this usually involves creating separate copies of the model, making edits, and manually tracking changes. This process introduces risk, complexity, and inconsistency.
A treasury solution can embed scenario logic directly within the core forecast model. Teams can adjust assumptions and immediately see the resulting impact without duplicating files. BI tools can also help compare multiple outcomes, though they tend to focus more on visualization than modeling. While Excel can technically handle scenario analysis, it becomes increasingly difficult to manage as models grow in complexity.
Scenario planning is most valuable when it is easy to update and repeat. A system that supports integrated scenario modeling allows treasury teams to deliver timely insights, even when new questions emerge.
If you’ve ever been caught off guard during a liquidity crisis or revenue drop, this walkthrough of forecasting inflection points shows how treasury leaders can regain control fast.
Consolidated Reporting With Variance Insight
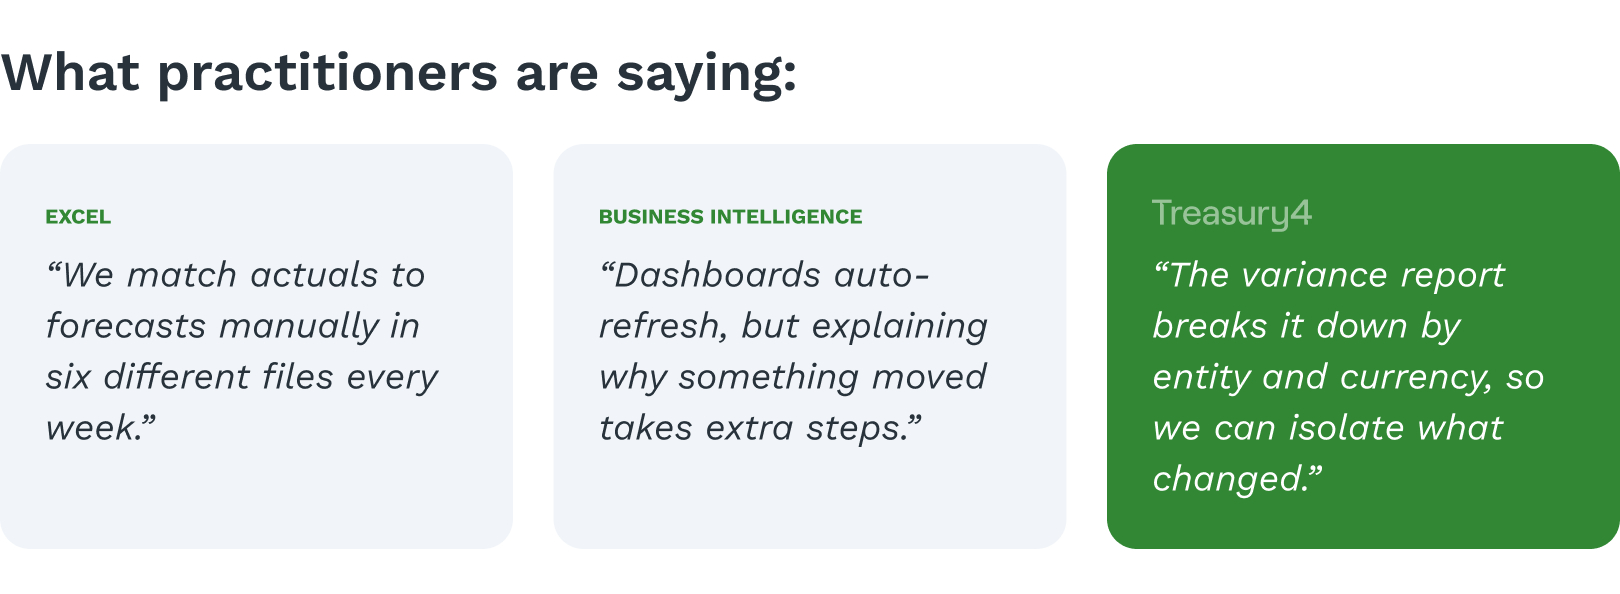
Effective reporting should do more than summarize results. It should reveal where actual performance diverged from expectations and why that happened.
Cash and treasury platforms link reporting directly to forecasting and cash data. This allows real-time visibility into variances and provides drill-down capabilities. BI tools are strong in presenting this information, especially when drawing from multiple systems like ERP and AP/AR. Excel can be used for variance analysis, but typically requires manual effort and lacks an audit trail.
What sets some treasury platforms apart is native integration with powerful BI tools like Sigma. Instead of relying on external tools like Power BI or Tableau—which require manual configuration and IT support—teams can explore trends, variances, and performance drivers in a fully embedded environment. Dashboards auto-refresh with live data, users can slice results by entity or currency, and AI/ML models can surface patterns and anomalies automatically.
This kind of built-in reporting doesn't just speed up the monthly close or board prep. It turns reporting into a feedback loop—helping treasury teams refine forecasts, respond faster, and drive decisions with more confidence. It’s a level of data clarity and adaptability that disconnected tools often can’t match.
Why Embedded Business Intelligence Changes the Equation
Most treasury teams evaluating Power BI or Tableau are asking the wrong question. The real question isn't which BI tool to add — it's whether your treasury management platform should come with one already built in.
The difference matters more than it sounds. External BI tools like Power BI and Tableau are powerful, but they're designed for data generalists, not treasury practitioners. Getting them to work with treasury data requires custom data pipelines, IT support, ongoing maintenance, and a significant investment of time before a single useful dashboard goes live. And when your underlying treasury data changes — new bank accounts, new entities, new currencies — those pipelines need to be updated too.
Treasury4 takes a different approach. Sigma, a cloud-native business intelligence and analytics platform, is embedded directly inside Treasury4. That means treasury teams get enterprise-grade BI capabilities without the configuration overhead, IT dependency, or disconnected data problem that comes with bolt-on tools.
What Embedded BI with Sigma Actually Enables
Here's what treasury teams get when BI is native to the platform rather than layered on top of it:
Live dashboards connected directly to treasury data Sigma dashboards inside Treasury4 auto-refresh with live bank data, entity records, and cash flow actuals. There's no manual export, no scheduled refresh, and no stale data. When a bank balance changes or a transaction posts, the reporting layer reflects it immediately.
No IT dependency to build or maintain With Power BI or Tableau, treasury teams typically rely on data engineers or IT to build and maintain the connections between source systems and the BI layer. Inside Treasury4, that infrastructure already exists. Treasury practitioners can build, customize, and share reports without submitting a ticket or waiting for a sprint cycle.
AI and machine learning built into the reporting layer Because Sigma operates on top of Treasury4's structured, deeply labeled transaction data, AI and ML models can surface patterns, flag anomalies, and highlight variance drivers automatically. This isn't a separate analytics module — it's built into the same environment where treasury teams manage cash, entities, and forecasts.
Slice by entity, currency, region, or bank without custom data modeling Treasury data has a specific structure — legal entities, bank accounts, counterparties, currencies, jurisdictions. Sigma inside Treasury4 understands that structure natively. Teams can filter, pivot, and drill down across any dimension without needing a data model built from scratch.
Reporting that feeds back into forecasting Because the BI layer shares the same data foundation as the forecasting engine, variance analysis isn't a separate exercise. When actuals diverge from projections, treasury teams can trace the cause directly within the platform and use that insight to refine the next forecast cycle. This closes the loop between reporting and planning in a way that disconnected tools simply can't replicate.

Which Method Most Supports Forward Visibility?
Each method—Excel, BI, and treasury solutions—has its place. Excel remains a useful tool due to its flexibility and accessibility, but it requires significant manual effort. BI tools can provide deep insights and visualizations but depend on strong data pipelines and require time to build. Modern treasury platforms offer speed and structure tailored to treasury workflows, but they involve more investment.
The more important question is whether your current approach supports the four capabilities that matter most: access to timely data, adaptable and transparent forecasts, integrated scenario modeling, and reporting that sharpens over time.
Achieving forward visibility isn’t about selecting a single tool. It’s about improving how information is collected, processed, and used to make decisions. For many teams, the path forward begins with addressing one critical gap in visibility or accuracy.
If you’d like help thinking through your current setup and where improvements might have the greatest impact, let us know.


